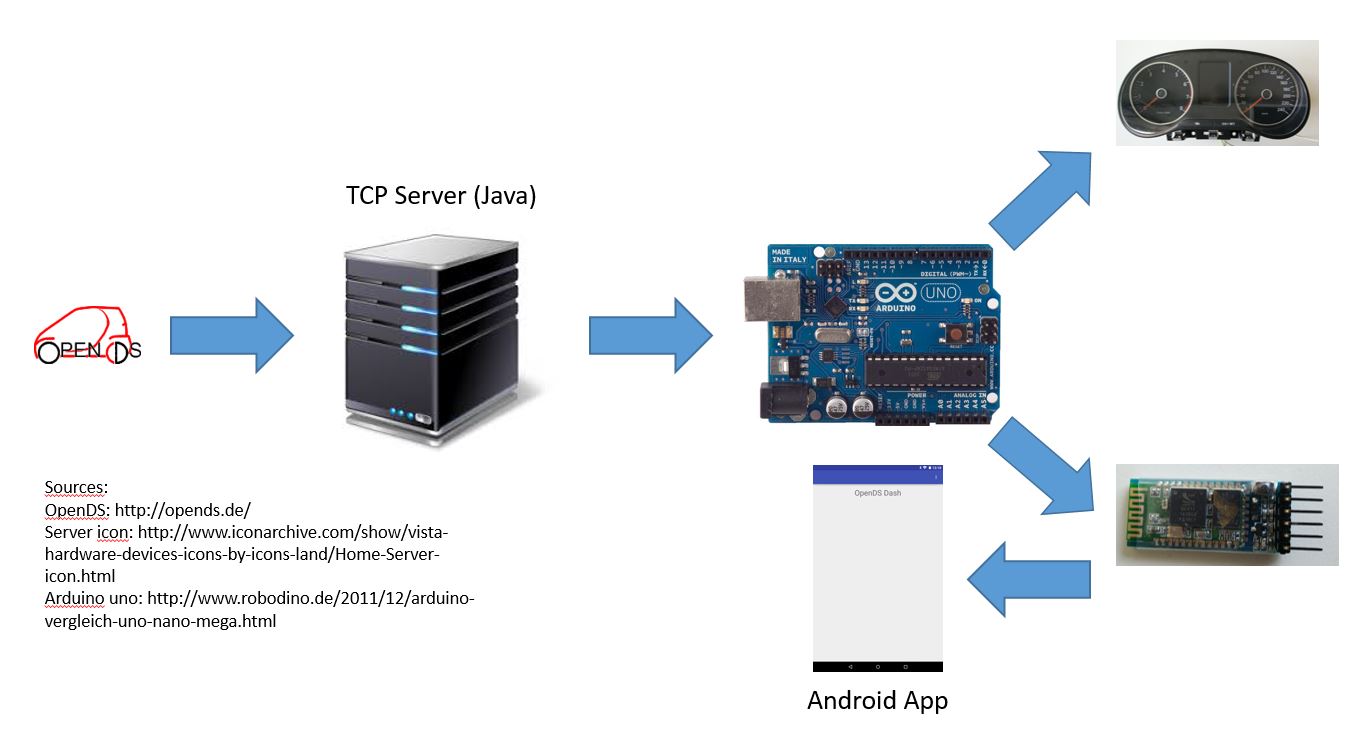
In order to get the data from the dirving simulator OpenDS to the app, several steps are implemented in our project. At first the OpenDS application sends the data via TCP to the TCP server implemented in Java. This server takes the information for speed, rpm of the engine, state of the lights and state of the turning signals and concatenates all the data into one string. Additionally, a start and end byte are eded to determine the beginning and the end of a full package. This string is send via the serial interface to the Arduino uno board. The board then sends the data to the speedometer via the CAN shield. In Addition, the Arduino uno sends the data to the connected bluetooth interface. From there the data will be send via bluetooth to the android app. The app takes the streamed String and parses it into the original data from the OpenDS application. The following image shows the communication paths for the data in our project.
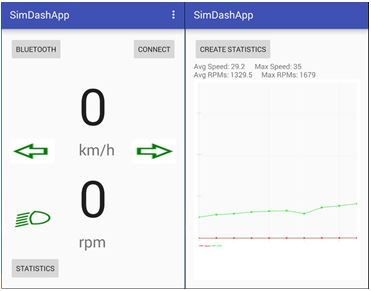
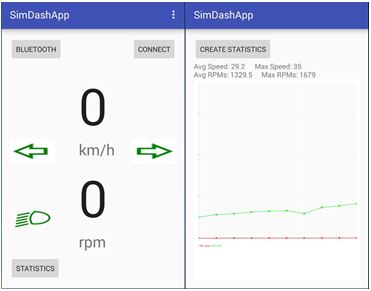
The frequency of the data being send via bluetooth can be configured in the TCP server as the Arduino uno only takes the stream and sends it to the bluetooth interface wihtout any further actions. It functions as a relay in this context. However, for sending the data to the speedometer, the Arduino needs to take the string apart. The app retreives the data and shows the live values. Additionally, it provides some statistics for the driving session such as maximum speed and average speed and some more. We will send the data via Bluetooth 4.0. We do not use the low energy mode as we will send the data in intervals of about 50 to 100 milliseconds or even faster. For these intervals a build-up and tear-down of the connection would be too much overhead in this situation. With these short intervals it will be an additional task to design the app as energy efficient as possible so the battery doesn't drain out after a short time. To accomplish this goal, the statistics get calculated at the end of a driving session. The end of such a session needs to be singaled manually, as the app cannot foresee the end of the session or the user's intentions. Therefore, we need a user interaction.
Another challenge is to get the intervals for the speedometer right as it needs some signals in a specific interval. Since we don't know these intervals for sure, it's more of a try-and-error process. Those package intervals are specified by the manufacturer, in this case Volkswagen. We have no option to get the required data for those package intervals, so we need to guess them as good as we can.